Fortinet Support - Tips on opening tickets with their TAC to make them more effective
- Introduction
- There are 2 ways to open a ticket - via phone, and on the web, use both of them, if needed.
- Have someone NSE 4 certified to open the ticket - gets you straight to the Level 2 Support.
- Ongoing communication - phone or email?
- If you work for a Partner, search for your issue in the Bug Tracker.
- Upload the configuration of the device in question
- Ask for a Remote Session
- Gather and upload
diagnose debug flowwhen traffic is being blocked - Run a packet sniffer to catch the affected by the issue traffic
- Run
execute tac report, capture its output and attach to the case - Run specific daemon debug, capture its output, attach to the case
Introduction
Below you will find ways to make your experience with Fortinet TAC better, speedy, and resultative. Not all steps may fully apply to you or your specific situation, as I write it from Fortinet Partner standpoint. Let’s begin.
There are 2 ways to open a ticket - via phone, and on the web, use both of them, if needed.
The web portal of https://support.fortinet.com allows you to open
tickets only of (low) Priority 3, and 4 (P3/P4), with P4 being the lowest. Even if
you open a ticket with a low priority, you can call in the TAC and request the
priority escalation to P1/P2, depending on the case severity. I, personally,
even when the case is pressing, first open a ticket on the web, then immediately
call the TAC to increase the priority and ask for the case to be assigned to the
TAC Engineer. The benefit here is that website allows to upload
debug/config/error messages when opening a ticket, unlike direct phone call. Even
on the direct phone call, you will have to wait while the TAC Engineer opens the
very same ticket on Support Portal, just a waste of time for both of us.
Have someone NSE 4 certified to open the ticket - gets you straight to the Level 2 Support.
I cannot tell the difference, because the tickets I open always land with the Level 2 Support, but people on the Internet say it is worth it. If you open a ticket with the account that has a valid NSE 4 or higher certification on it, you are supposed to reach Level 2 Support automatically.
Ongoing communication - phone or email?
The difference is huge, that is why, I guess, they assign Portal-opened tickets low priority by default. Email/Support portal communication is fine, but clearly is low priority for the Fortinet. You can wait for days for a ticket to be updated, to just pick up the phone and get the answers/updates immediately. So, if you see no updates on a ticket - just call the TAC, tell the answering person the ticket number and you will be connected with the TAC Engineer working on the case. Also, it happened in the past that Fortinet mailers got black-listed by various mail providers and their notification mails got directly into the spam folder.
If you work for a Partner, search for your issue in the Bug Tracker.
The Bug Tracker is available to Partners only, not the end clients. You find it on the Support → Bug Tracker:
Inside, you can filter bugs by status, product, firmware version, or search by free text description. This tool saved me time when I was about to open a ticket on already known issue:
Upload the configuration of the device in question
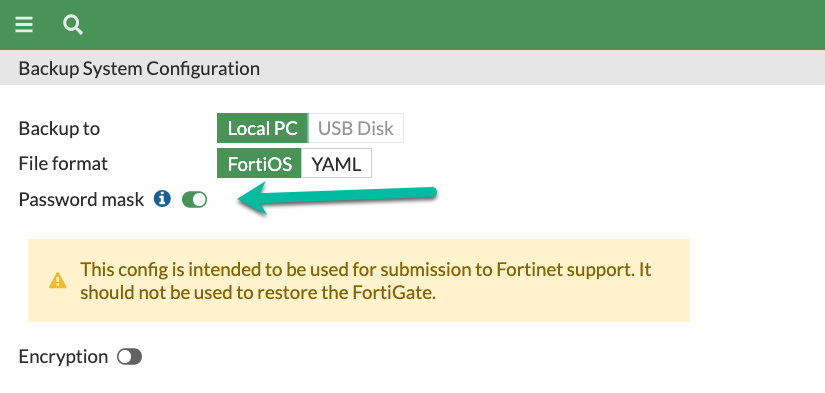
You can either export the configuration as a file, or run appropriate command on CLI to show the configuration while writing the CLI output to a file. For non-trivial issues Fortinet will set up a lab with the device configuration you upload to the case. For privacy concerns, you may, in Fortigate at least, mask all the passwords/keys when exporting the configuration:
Uploading a config is not a must of course, but will speed up the ticket. Also good idea, before exporting the config, is to add a temporary administrator account for the Fortinet TAC to use, later to be deleted from the actual device.
Ask for a Remote Session
If you have an urgent issue, or you cannot upload any configs for security reasons - feel free to ask, after opening the ticket, for a remote session. I don’t remember a single time for Fortinet folks to answer "no" to such requests. It depends on the TAC Engineer availability of course, but usually the response is quite fast.
Gather and upload diagnose debug flow when traffic is being blocked
When issue is with the traffic passing the Fortigate, run dia debug flow with
the appropriate filters and save the output. Here is the cheat sheet to the
command:
Security rulebase debug (diagnose debug flow). And don’t forget that with newer
Fortigate - 7.2 or newer, you can also get it in the GUI as well, short video
how:
diagnose debug flow in the GUI
Run a packet sniffer to catch the affected by the issue traffic
TAC will almost always ask for packet sniffer, preferably without any filters,
when the issue occurs. For Fortigate, you can either run it on CLI dia sni packet with
verbosity of 6 and save output as a text file, or, in the GUI and save it as a
.pcap file ready for upload to the case. Here is a short video on how to use the
packet sniffer in GUI:
Improved
packet sniffer in the GUI. And here is the command line options:
diagnose sniffer packet
Many products by Fortinet have embedded sniffers as well, but the syntax
differs. E.g. in the FortiWeb it is diagnose network sniffer.
Run execute tac report, capture its output and attach to the case
This command runs lots of diagnostics that may help TAC Engineers. The command is for Fortigate, but other products may have an analog as well, even if by other name.
Run specific daemon debug, capture its output, attach to the case
When issue is with a specific daemon, and you know which one, it will shorten the
ticket time if you run the debug for this daemon beforehand. You can try to find
the exact name of the daemon in the diagnose sys top output, or do it in the
GUI (much easier):
diagnose
sys top process monitor in the GUI. You can find debug options for this daemon
then with the Google search. Some of the daemons and their debug options can be
found on my cheat sheet on Github:
Fortigate
debug diagnose cheat sheet
Follow me on https://www.linkedin.com/in/yurislobodyanyuk/ not to miss what I publish on Linkedin, Github, blog, and more.