Fortigate how to verify that IPS is actually working
Is your IPS actually doing what you expect? You have to test your configurations, especially with the Intrusion Prevention System, which demands not only On/Off switch, but also tuning or it may become useless. With AntiVirus we have Eicar fake virus on eicar.org to download. With IPS there is no such well-known service. So here is how to test your Fortigate IPS configuration. I can see 2 ways:
- Create custom IPS signature . Pros: you can match any traffic, even valid one as "malicious" and thus trigger the IPS. This makes it easy to test - just match your PC IP address, and try generating any traffic. The cons of it is that if you err and create wrong signature it may mislead to either false positive or false negative. This way it becomes testing your signature writing skills rather than IPS functionality.
- Use build-in signature. It is closer to real life testing. The problem, though, is to create environment "vulnerable" enough to trigger a real IPS signature. Vulnerable host(s) in the network is never a good idea, even just for testing. And testing vulnerabilities on patched anad non-vulnerable hosts i s usually fruitless. E.g. running Metasploit "MS.SMB.Server.SMB1.Trans2.Secondary.Handling.Code.Execution" exploit on patched Windows 10 will not trigger this signature because before sending the exploit, Metasploit runs auxiliary module to test if the target is vulnerable. If the target is not vulnerable, the payload will not be sent (by default) and IPS will not fire.
So what I do is modified Case 2 way - I run built-in signature , but using just rate-based signatures. This way I don't need to make any host vulnerable, and the signatures are easy to trigger.
Case study: I will configure "HTTP.Authentication.Brute.Force" Fortiguard Labs to trigger on 10 failed authentication attempts to Apache server.
Apache configs.
- Create user with password.
- Enable authentication on some throw away directory.
Create user test with pass qwe123:
htpasswd -c /etc/passwords test
Protect directory :
<Directory /var/www/html/>
        AuthType Basic
        AuthName "Restricted Access"
        AuthBasicProvider file
        AuthUserFile "/etc/passwords"
        Require user test
</Directory>
apachectl restart
Fortigate
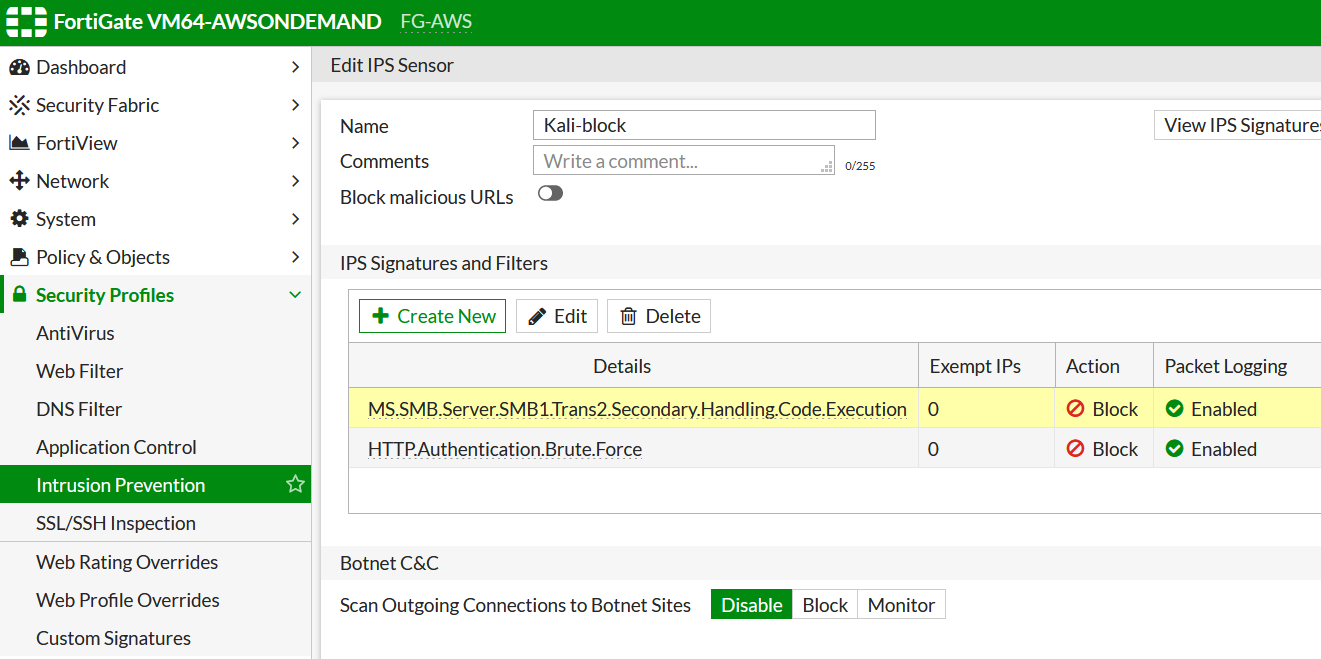
Let's create new IPS sensor and add this signature (the other one in the picture is unrelated):

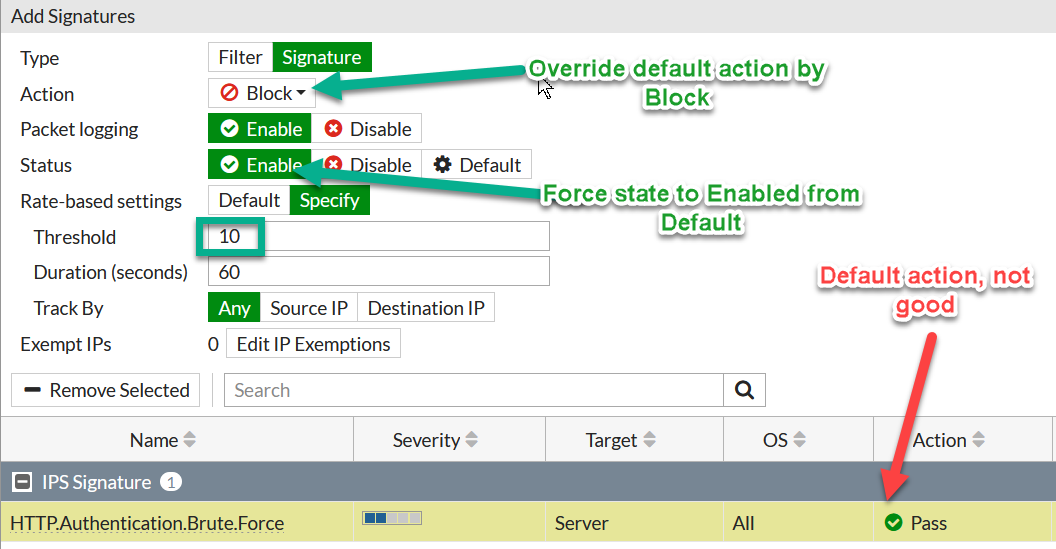
The signature itself should be tuned or it will not trigger. The reason is that based on the signature false positive probability, Fortinet assign actions either Block or Pass. Where Pass means the matched traffic will pass unhalted. Just like that. So we have to change the action to Block, and lower trigger value - by default (see URL above) this signature triggers on > 200 failed attempts per minute. I would need lots of bruteforce parallel sessions to generate such a high threshold, so I lower it to 10.

Now we can use the IPS sensor in the Security Policy:

Finally, we can verify whether the IPS functions as expected. I am using thc-hydra to brute-force the authentication:
hydra -l test -P 1000passwords.txt 3.123.8.115 http-get
Where:
test - username to try.
1000passwords.txt - text file with 1000 random passwords from the Internet.
3.123.8.115 - external IP of the Fortigate.
http-get - HTTP GET method to use to query for the page and be presented with Authentication Required.
Full CLI config:
NOTE1: additionally I set action towards attacker to quarantine so it will block not just packets of the attack itself, but ANY packets coming from this source IP. The default quarantine time is 5 minutes, I increased it here to 10 minutes with the command set quarantine-expiry 0d0h10m.
NOTE2: You can exempt some IPs from this signature as I show below for the 10.10.10.1
NOTE3: I enabled log-packet to save contents of the attacking packets as .pcap files, but use it with care as can use lots of disk space over the time.
NOTE4: The last entry - 5 (actually unrelated to the specific signature, just as a note), is using filter instead of specifying exact IPS signature ID, as 2 and 3 do. Here I pick signatures that have OS defined as BSD and whom it should protect - client.
config ips sensor
    edit "Kali-block"
        config entries
            edit 2
                set rule 43796
                set status enable
                set log-packet enable
                set action block
            next
            edit 3
                set rule 20949  <-- HTTP.Authentication.Brute.Force
                set status enable
                set log-packet enable <-- Archive the whole packet as PCAP on the harddisk
                set action block      <-- Override the default action to Block
                set rate-count 10     <-- Lower the default 200 to just 10 per minute
                config exempt-ip
                            edit 1
                                set src-ip 10.10.10.1 255.255.255.255
                            next
                        end
                set quarantine attacker
                set quarantine-expiry 10m
            next
                edit 5
                set location client
                set os BSD
            next
        end
    next
end
Verification
See quarantined IPs (in case action quarantine is enabled inside the sensor):
diagnose user quarantine list
src-ip-addr       created                  expires                  cause
8.4.62.16     Tue Jul 28 03:17:42 2020 Tue Jul 28 03:27:42 2020 IPS
Here the 8.4.62.16 is "attacker", and 10.17.7.11 is the Web server attacked.
To remove all quarantined hosts in one go:
diagnose user quarantine clear
To add/delete specific host to the quarantined list:
diagnose user quarantine add src4/src6 ...
NOTE: Quarantine list is kept in kernel and thus available and used by many other modules of Fortigate, like Antivirus, DLP etc. This means if an IP gets quarantined, it will be blocked not just by IPS and rules it contains, but by other modules as well. So the quarantined host will be blocked totally by the Fortigate.
Create a filter (optional) and list all sessions passing the IPS sensor in the stateful sessions table:
diag ips filter set "port 80"
diag ips filter status
DEBUG FILTER:
  debug level: 0
  filter: "port 80"
  process id: 0
To see all sessions IPS is following:
dia ips session list
Total TCP sessions: 3
SESSION id:76 serial:3664 proto:6 group:6 age:1769 idle:1768 flag:0x100026
        feature:0x2 encap:0 ignore:0,0 ignore_after:204800,204800
  C-8.4.62.16:59998, S-10.17.7.11:80
  state: C-CLOSE_WAIT/130/0/0/0/0, S-FIN_WAIT_1/695/0/0/0/0 pause:0, paws:0
  expire: 1832
  app: unknown:0 last:0 unknown-size:0
  cnfm: http
  set: http sip rtsp
  asm: http
SESSION id:78 serial:3672 proto:6 group:6 age:1769 idle:1768 flag:0x100026
        feature:0x2 encap:0 ignore:0,0 ignore_after:204800,204800
  C-8.4.62.16:59990, S-10.17.7.11:80
  state: C-CLOSE_WAIT/130/0/0/0/0, S-FIN_WAIT_1/695/0/0/0/0 pause:0, paws:0
  expire: 1832
  app: unknown:0 last:0 unknown-size:0
  cnfm: http
  set: http sip rtsp
  asm: http
SESSION id:83 serial:4080 proto:6 group:6 age:483 idle:483 flag:0x100026
        feature:0x2 encap:0 ignore:0,0 ignore_after:204800,204800
  C-8.4.62.16:60058, S-10.17.7.11:80
  state: C-CLOSE_WAIT/130/0/0/0/0, S-FIN_WAIT_1/695/0/0/0/0 pause:0, paws:0
  expire: 3117
  app: unknown:0 last:0 unknown-size:0
  cnfm: http
  set: http sip rtsp
  asm: http

Total UDP sessions: 0

Total ICMP sessions: 0

Total ICMP6 sessions: 0

Total IP sessions: 0
dia test application ipsmonitor 13
Session List: pid=1043
vf=0 proto=6 8.4.62.16:59998->10.17.7.11:80
vf=0 proto=6 8.4.62.16:59990->10.17.7.11:80
Session List: total=2
Session List: pid=1044
vf=0 proto=6 8.4.62.16:59994->10.17.7.11:80
vf=0 proto=6 8.4.62.16:60004->10.17.7.11:80
Session List: total=2
Session List: pid=1045
Session List: total=0
Session List: pid=1046
vf=0 proto=6 8.4.62.16:59996->10.17.7.11:80
Session List: total=1
THis command shows health statistics of the IPS, so DROPS there means not blocked attack packets, but packets IPS was unable to process:
diagnose ips packet status
# diagnose ips packet status

PID: 1043

PACKET STATISTICS:
  total packets    823
  tcp packets      823
  udp packets      0
  icmp packets     0
  other packets    0
  fast path bad packets    0
  fast path other packets  0
  fast path nocfg packets  0
  fast path invcfg packets 0
  fast path config changed packets 0
  slow path invcfg packets 0
  tcp PAWS packets 0
  huge packets     0

PACKET ACTION STATISTICS:
  PASS                          821
  DROP                          0
  RESET                         0
Another general stats of IPS command:
diag ips session performance
PERFORMANCE STATISTICS
name           :       sess |       pkts   cycles |       pkts   cycles
decoder        :          0 |        823     2163 |          0        0
session        :          0 |        823     1252 |          0        0
protocol       :          0 |        822     8454 |          0        0
application    :          0 |        751    16122 |          0        0
detect         :          0 |          0        0 |          0        0
match          :          0 |       2731     2801 |          0        0
NC match       :          0 |       5698      816 |          0        0
Cross Tag      :          0 |         79    13864 |          0        0
-------------------------------------------------------------------------
Number of hits per signature activated:
diag ips sign hit
SIGNATURE PERFORMANCE: 853 packets
------------------------------------------------------+-------------------------------------------------
                       Pattern                        |                         Non-Pat
------------------------------------------------------+-------------------------------------------------
  #     Attack ID                Hits          Cycles |   Attack ID                Hits          Cycles
------------------------------------------------------+-------------------------------------------------
    1    64474 (Ih-)              78            6567  |     68480 (Ih-)             478             458
    2    15425 (I--)              78            2166  |     68661 (Ih-)             478             282
    3    51312 (Ih-)              78            1517  |     72387 (Ih-)             246             495
    4    22607 (I--)              78            2074  |     67810 (I--)             232             693
    5    57955 (I--)              78            2404  |     67812 (Ih-)             232             300
    6    56472 (I--)              78            2299  |     60398 (Ih-)             232            1423
    7    35945 (I--)              78            2691  |     44961 (Ih-)             232             907
    8    49214 (I--)              78            1355  |     44962 (Ih-)             232             260
    9    37958 (Ih-)              78            3615  |     72388 (Ih-)             232             248
   10    72298 (I--)              78             640  |     51952 (Ih-)             175             904
--------------------------------------
----------------+-------------------------------------------------
And the final way to see IPS works - diagnose debug flow. In its output, watch that sessions are being sent to the IPS: msg="send to ips".
diag debug flow filter "port 80"
dia deb flow show function
dia debug enable
dia deb flow trace start
# id=20085 trace_id=1 func=print_pkt_detail line=5501 msg="vd-root:0 received a packet(proto=6, 8.4.62.16:60086->10.17.5.217:80) from port1. flag [S], seq 961143888, ack 0, win 64240"
id=20085 trace_id=1 func=init_ip_session_common line=5666 msg="allocate a new session-0000126a"
id=20085 trace_id=1 func=fw_pre_route_handler line=181 msg="VIP-10.17.7.11:80, outdev-port1"
id=20085 trace_id=1 func=__ip_session_run_tuple line=3300 msg="DNAT 10.17.5.217:80->10.17.7.11:80"
id=20085 trace_id=1 func=vf_ip_route_input_common line=2596 msg="find a route: flag=00000000 gw-10.17.7.11 via port2"
id=20085 trace_id=1 func=fw_forward_handler line=771 msg="Allowed by Policy-1: SNAT"
id=20085 trace_id=1 func=ids_receive line=289 msg="send to ips"  <-- This tells us that connection is offloaded to IPS
id=20085 trace_id=1 func=__ip_session_run_tuple line=3286 msg="SNAT 8.4.62.16->10.17.7.10:60086"
In the above:
8.4.62.16 - attacker.
10.17.5.217 - External/WAN IP of the Fortigate.
10.17.7.11 - Internal IP of Ubuntu web server.
10.17.7.10 - port2 IP on the Fortigate in Ubuntu network (I enabled NAT over this port2).
Follow me on https://www.linkedin.com/in/yurislobodyanyuk/ not to miss what I publish on Linkedin, Github, blog, and more.